/1004/site-assets/phone.png)
/1004/site-assets/cart.png)
What is a Cartographer?
Ever wondered who's behind the maps that guide you through the maze of the modern world? Enter the cartographer!
These intrepid professionals are the masters of map-making, diving deep into the art and science of charting our planet's every nook and cranny.
Their job is no ordinary feat—it involves everything from trekking across rugged terrains to crunching numbers with ninja-like mathematical prowess.
Cartographers don't just doodle on paper; they're digital wizards too, harnessing cutting-edge technology to turn complex data into those sleek GPS maps that help you find your way from Point A to Point B (and occasionally Point Z if you're feeling adventurous). They're like modern-day explorers armed with satellites, drones, and laser beams—okay, maybe not laser beams, but definitely some seriously cool gadgets.

Geographic Information Systems (GIS)
GIS, or Geographic Information Systems, is a powerful tool that integrates data with spatial location. It allows users to analyze, interpret, and visualize information based on where things are located.
GIS is crucial because it helps organizations and individuals make informed decisions by providing insights into spatial patterns, relationships, and trends that are not immediately apparent from tabular data alone.
It supports a wide range of applications across industries such as urban planning, environmental management, public health, transportation, and emergency response.
By harnessing GIS, users can efficiently manage resources, optimize workflows, and solve complex spatial problems, ultimately leading to better planning, sustainability, and decision-making processes.
Digital Mapping Platforms
- Map Creation: Users can create digital maps by importing spatial data such as GPS coordinates, addresses, or geographic boundaries, and overlaying them onto base maps (like satellite imagery or street maps).
- Data Visualization: These platforms allow users to visualize data spatially, creating thematic maps that highlight patterns, trends, or relationships within the data.
- Spatial Analysis: Users can perform spatial analysis tasks such as buffering, proximity analysis, spatial querying, and overlay operations to derive insights from geographic data.
- Interactivity: Digital mapping platforms often support interactive features such as zooming, panning, and clicking on map elements to display additional information or perform actions.
- Collaboration: They facilitate collaboration by allowing multiple users to view and edit maps simultaneously, often through cloud-based or web-based platforms.
- Integration: Many platforms offer integration with other software tools and data sources, enabling users to combine geographic data with non-spatial data for comprehensive analysis.
- Application Development: Some platforms provide APIs (Application Programming Interfaces) or SDKs (Software Development Kits) that allow developers to build custom mapping applications or integrate mapping functionalities into existing applications.

Thematic Mapping
Visualizing Data
In fields like healthcare, data visualization helps medical professionals and researchers analyze patient trends, treatment outcomes, and epidemiological patterns. For example, charts, graphs, and interactive maps can illustrate disease prevalence across different regions or demographic groups, aiding in the formulation of targeted healthcare interventions.
In finance, cartographers' skills are utilized to create intuitive dashboards and charts that depict market trends, investment performance, and risk analysis. These visual tools empower decision-makers to make informed choices amidst complex financial landscapes.
Similarly, in social sciences, data visualization enhances the understanding of societal trends, demographic shifts, and economic disparities. By presenting data visually, researchers can uncover patterns and correlations that inform policy-making and social interventions.
Educational and Academic Roles
Cartographers also work in educational settings, either as cartography and GIS teachers or as educational materials creators.
In academia, they may engage in research pushing cartographic science's boundaries, including the development of new mapping technologies or methods for spatial analysis.
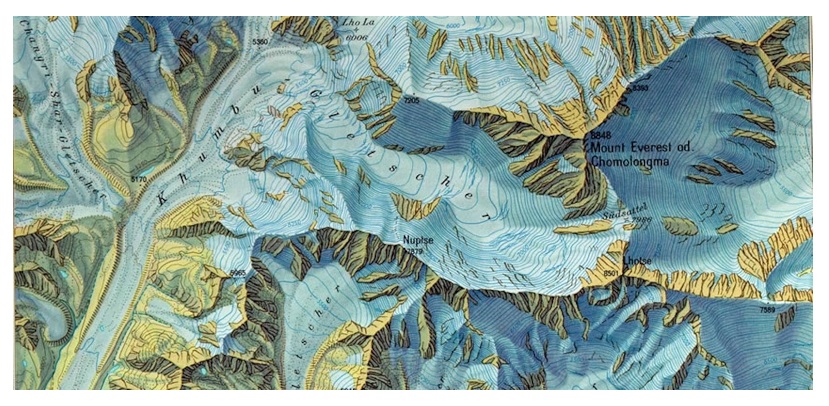
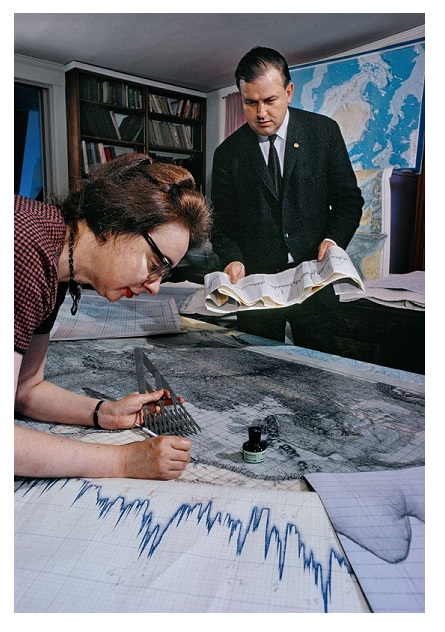
A prime example of a cartographer would be Marie Tharp.
Marie Tharp and Bruce Heezen were pioneering oceanographers whose collaboration in the mid-20th century fundamentally transformed our understanding of the ocean floor.
Marie Tharp, a geologist and cartographer, and Bruce Heezen, a geophysicist, worked together at Columbia University to map the undersea landscapes.
Tharp interpreted sonar data to create the first comprehensive maps of the Atlantic Ocean floor, which revealed the existence of the Mid-Atlantic Ridge, a continuous mountain range running through the Atlantic Ocean. This discovery was groundbreaking as it provided crucial evidence supporting the theory of plate tectonics, revolutionizing the field of geology.
Historical and Cultural Mapping
The rising interest in mapping historical and culturally significant places, events, and trends reflects a growing recognition of the value of visual storytelling in understanding our collective past and cultural heritage.
Cartographers are increasingly partnering with historians, anthropologists, and cultural organizations to produce maps that go beyond mere geographic representation. These collaborations yield rich, multidimensional visual narratives that capture the essence of historical developments, cultural phenomena, and societal changes over time.
In anthropology, mapping techniques can document the spatial distribution of cultural practices, languages, and rituals, providing a visual framework for understanding how cultural landscapes evolve and interact with the environment.
Similarly, cultural organizations might utilize these maps to highlight heritage sites, trace the impact of significant cultural movements, or showcase the geographical spread of artistic styles and traditions.
As interest in digital humanities and public history grows, these interdisciplinary mapping projects continue to play a crucial role in bringing historical and cultural knowledge to wider audiences, enriching our understanding of the world we live in.
A Few Final Words
Cartographers have evolved from mapmakers of ancient times to modern-day specialists in digital data visualization and geospatial analysis, adapting their craft to the complexities of our interconnected world.
Their ability to translate vast amounts of data into accessible, meaningful visual formats remains crucial today, driving innovation across fields like urban planning, environmental science, disaster management, and cultural preservation.
In an era where location-based insights are more valuable than ever, cartographers continue to play a vital role in shaping our understanding of both the natural and human-made landscapes, ensuring that we navigate our world with clarity and precision.
/1004/site-assets/dateseal.jpg "Serving Seattle since 1950")
/1004/site-assets/creditcards.png)